Monday, August 26. 2013
VMworld TV 2013 Opening Reception
Sunday, August 25. 2013
(Dutch) VMworld Zoetermeer 2013
VMworld is het jaarlijkse wereldwijde evenement van VMware. VMworld is de bron voor de kennis van virtualisatie en Cloud Computing technologieën van VMware gehouden in San Francisco en Barcelona.
VMware en KPN slaan de handen ineen en organiseren speciaal voor u VMworld Zoetermeer 2013. Voor u is het de ultieme mogelijkheid om in een hele korte periode geïnformeerd te worden over nieuwste ontwikkelingen rond VMware en hieraan gerelateerde producten.
Schijf in: VMworld Zoetermeer 2013
Wanneer: 25 september 2013 - 15.00 – 21.30
Locatie: KPN locatie Zoetermeer - Röntgenlaan 75, 2719 DX Zoetermeer
Thursday, August 22. 2013
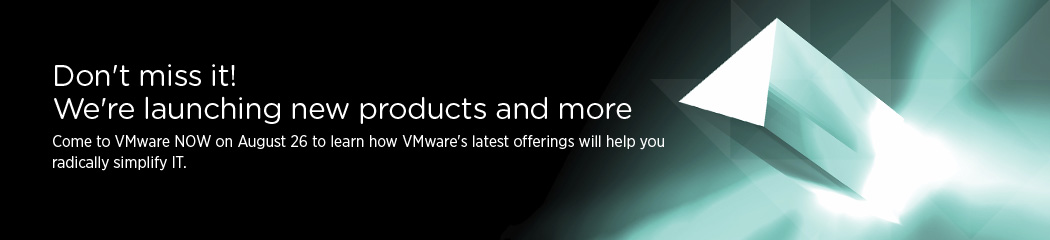
Register - VMware NOW – Live Launch Event
VMware NOW – Live Launch Event
Date: August 26, 2013
Time: 9:00 AM PDT
On August 26, visit VMware NOW—your online destination for breaking news, live events, product announcements, and more. You will discover how VMware is empowering organizations like yours to innovate and thrive by virtualizing IT infrastructure, from the data center to the cloud to mobile devices.
Tuesday, August 20. 2013
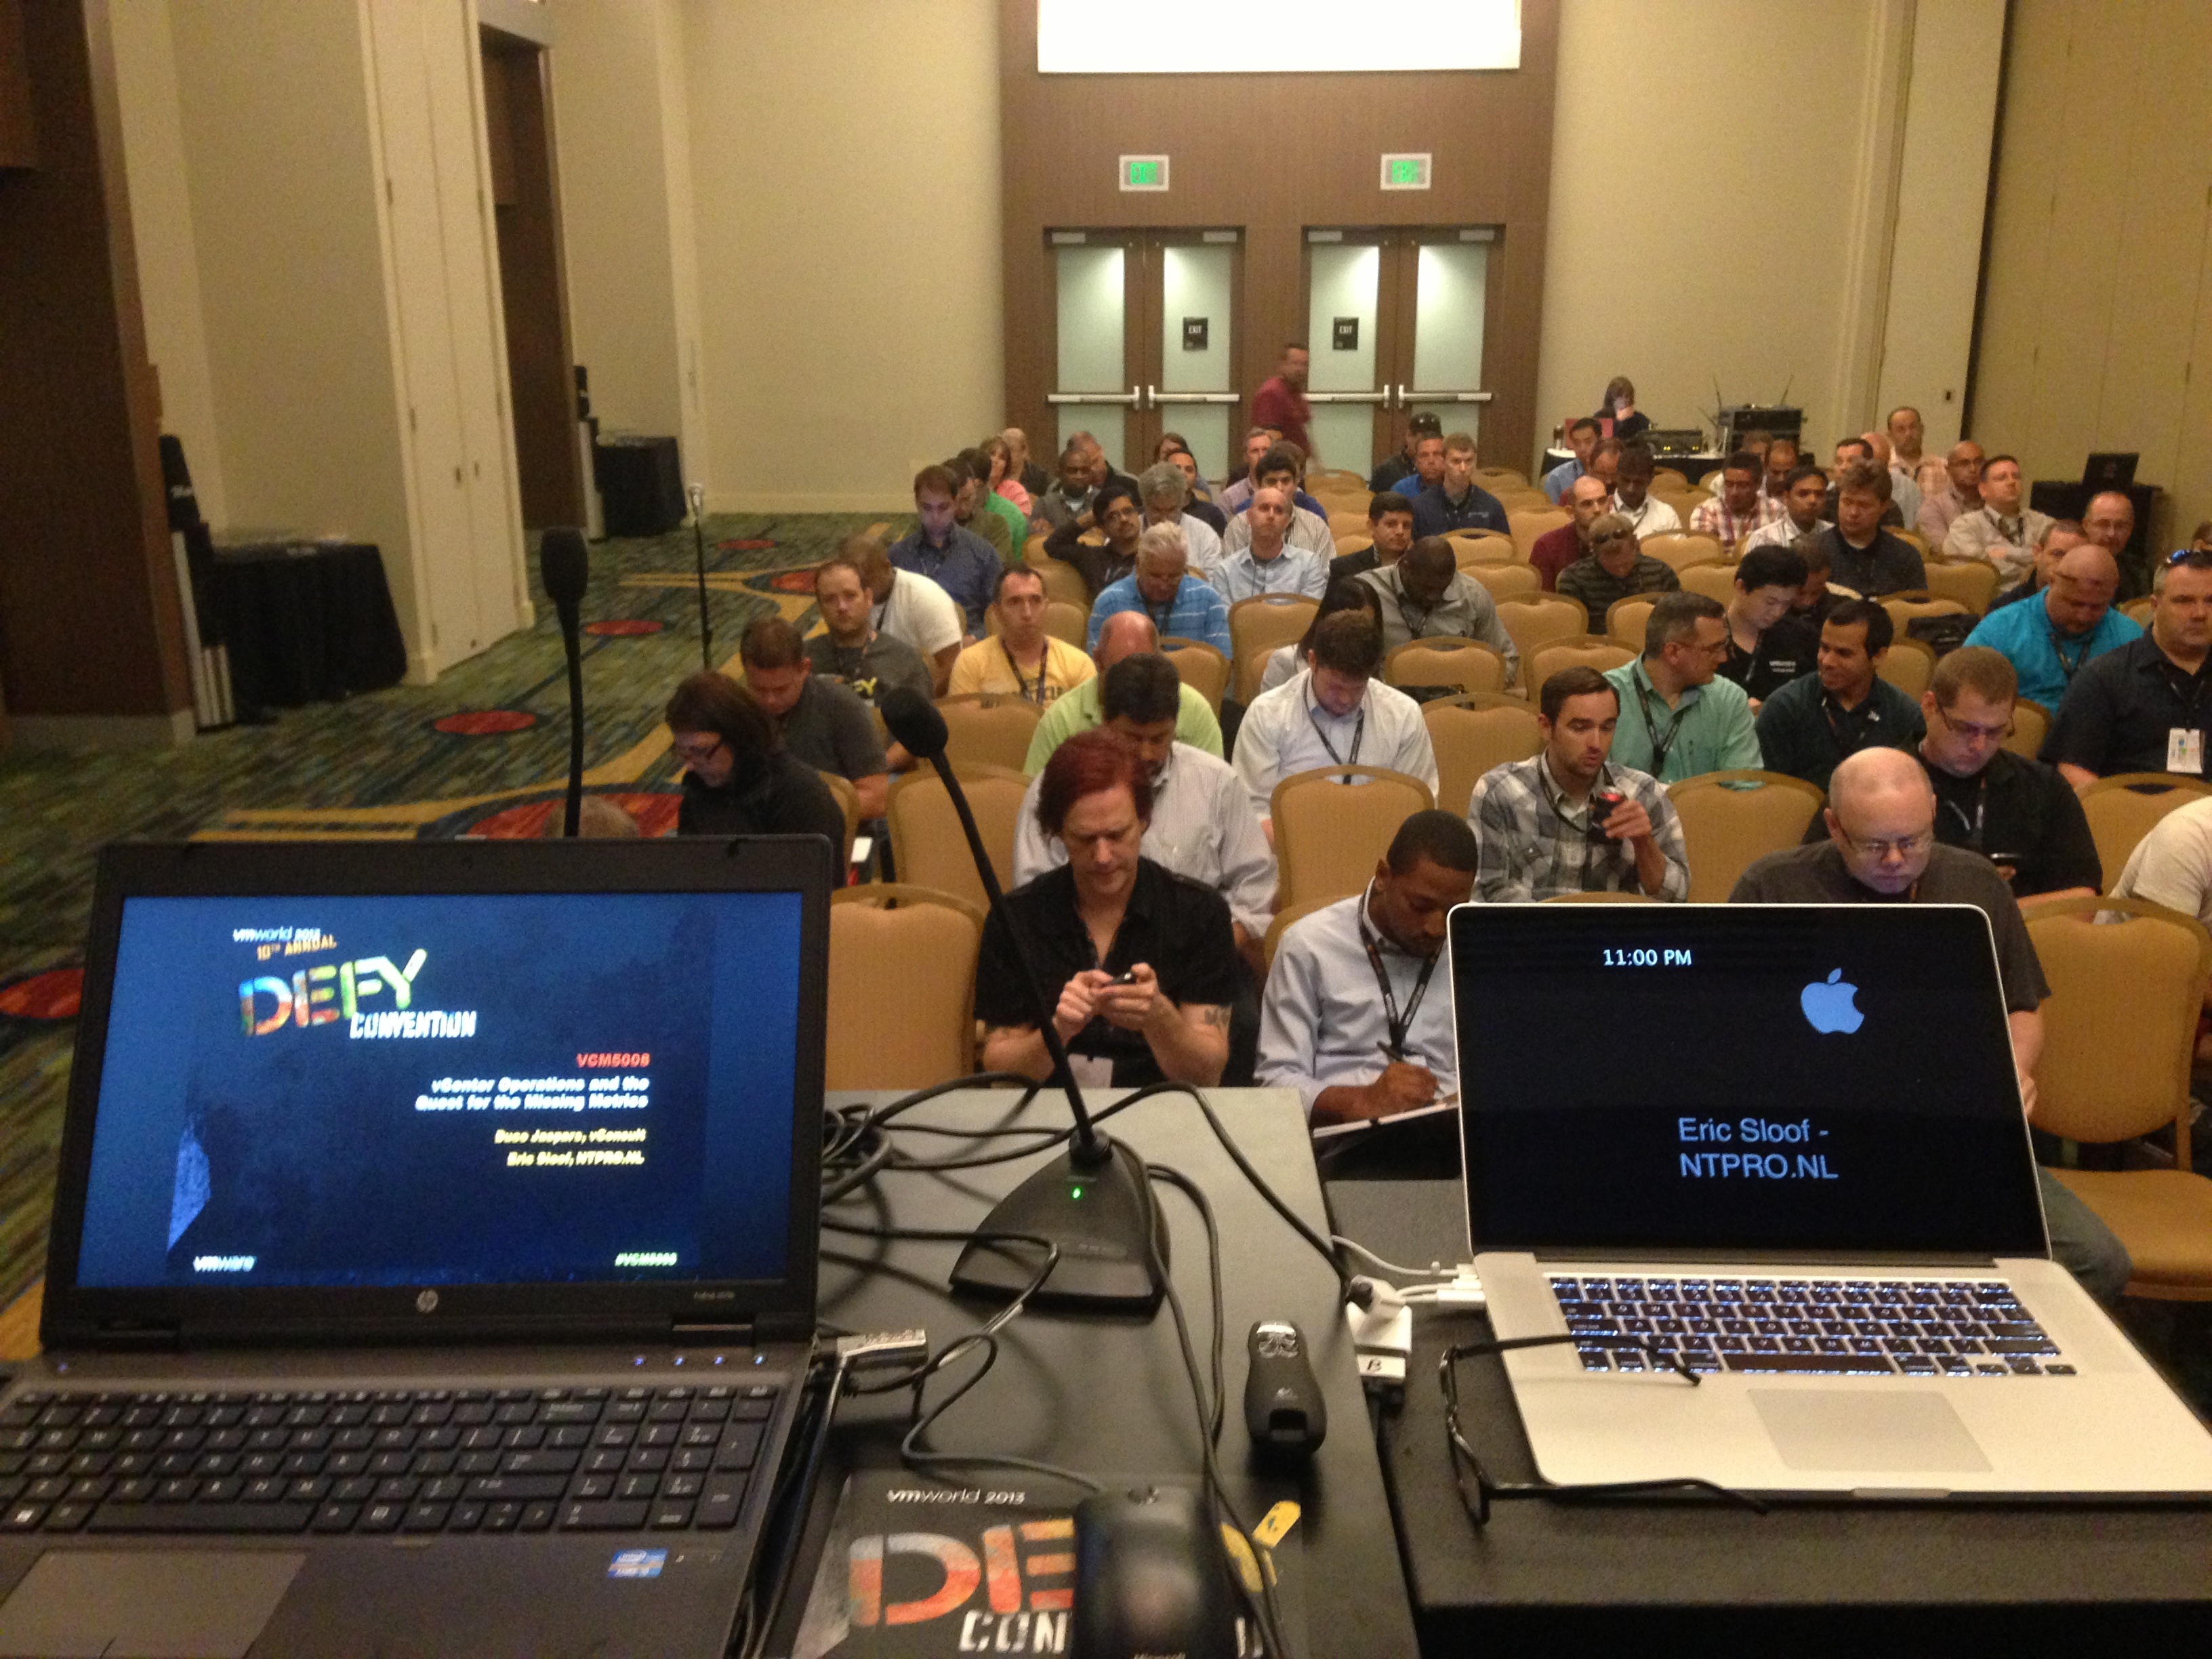
Eric Sloof Goes Behind the Scenes at the VMworld 2013 Hands-On-Labs
Cool Tool - Logstash open source log management
Cool Tool - Graylog2 open source log management
Graylog2, the free and open source log management solution enables you to unleash the power that lays inside your logs. Use it to run analytics, alerting, monitoring and powerful searches over your whole log base. Need to debug a failing request? Just run a quick filter search to find it and see what errors it produced. Want to see all messages a certain API consumer is consuming in real time? Create streams for every consumer and have them always only one click away.
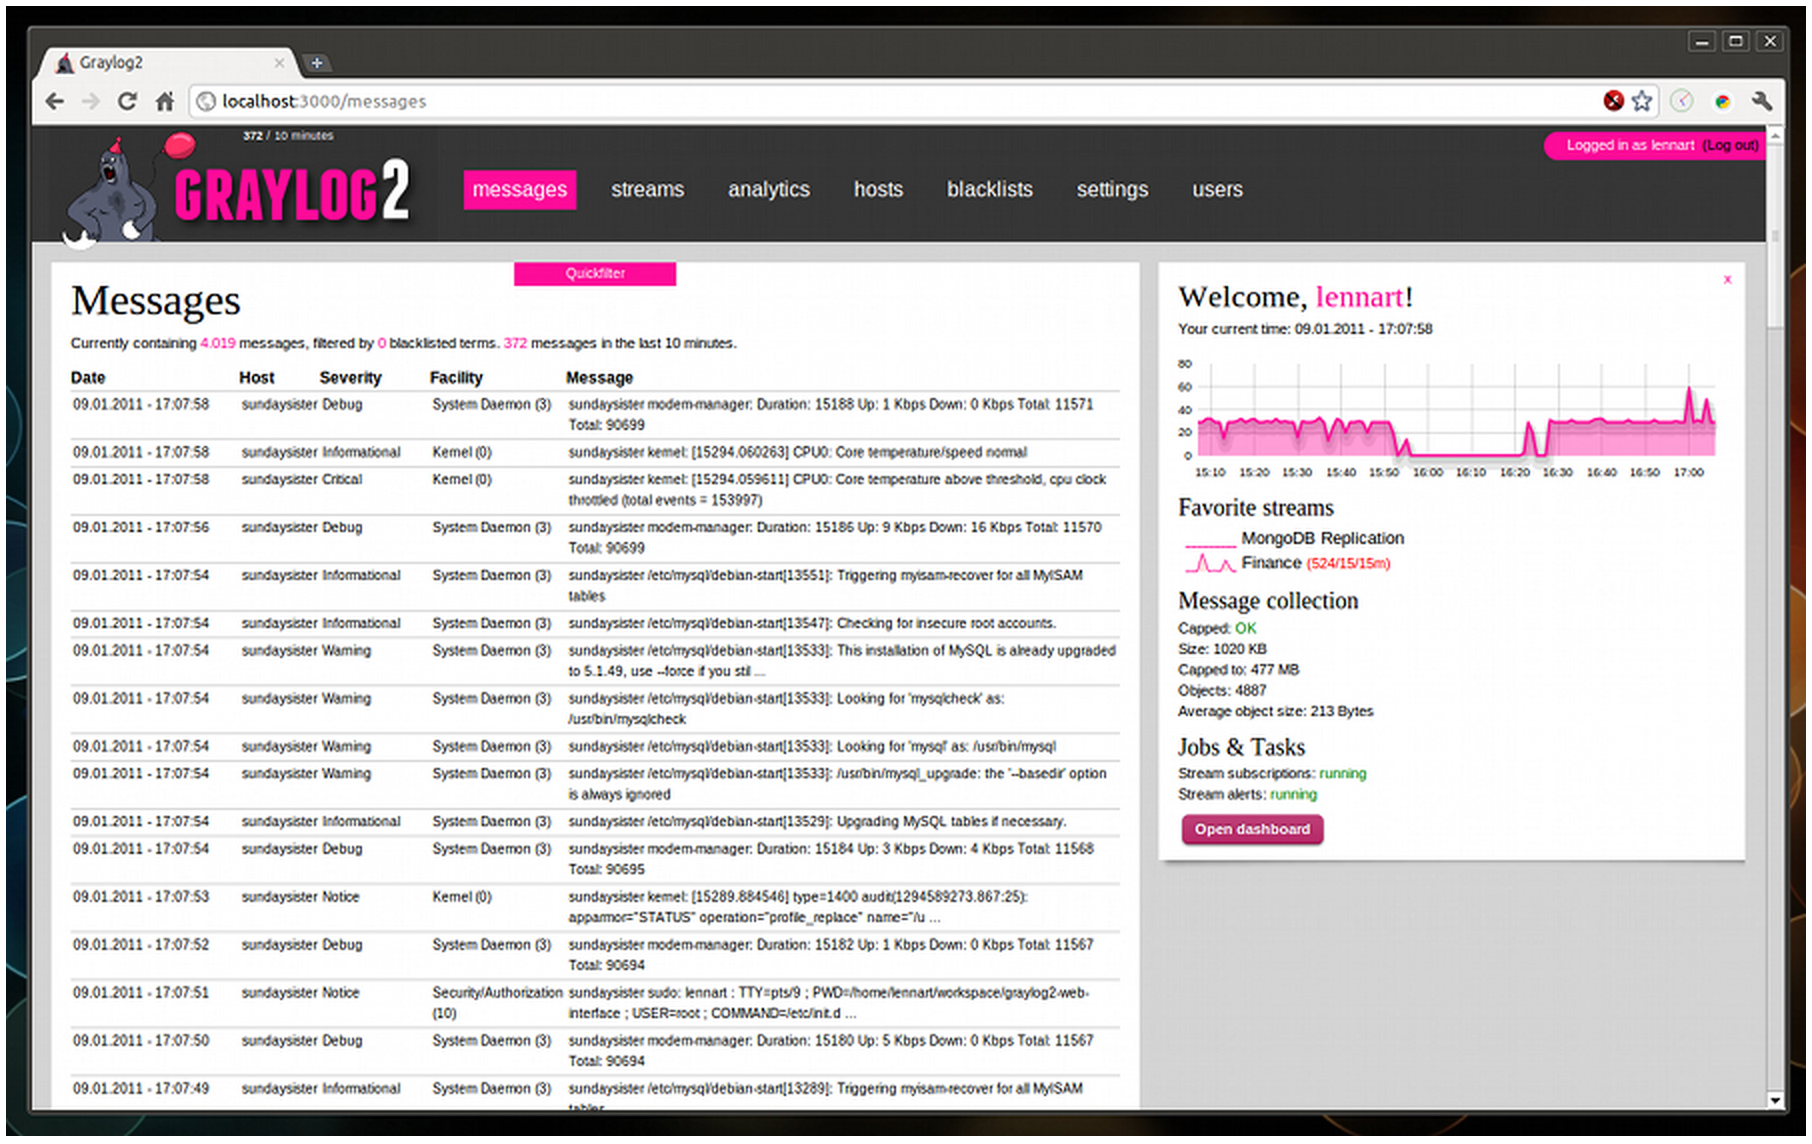
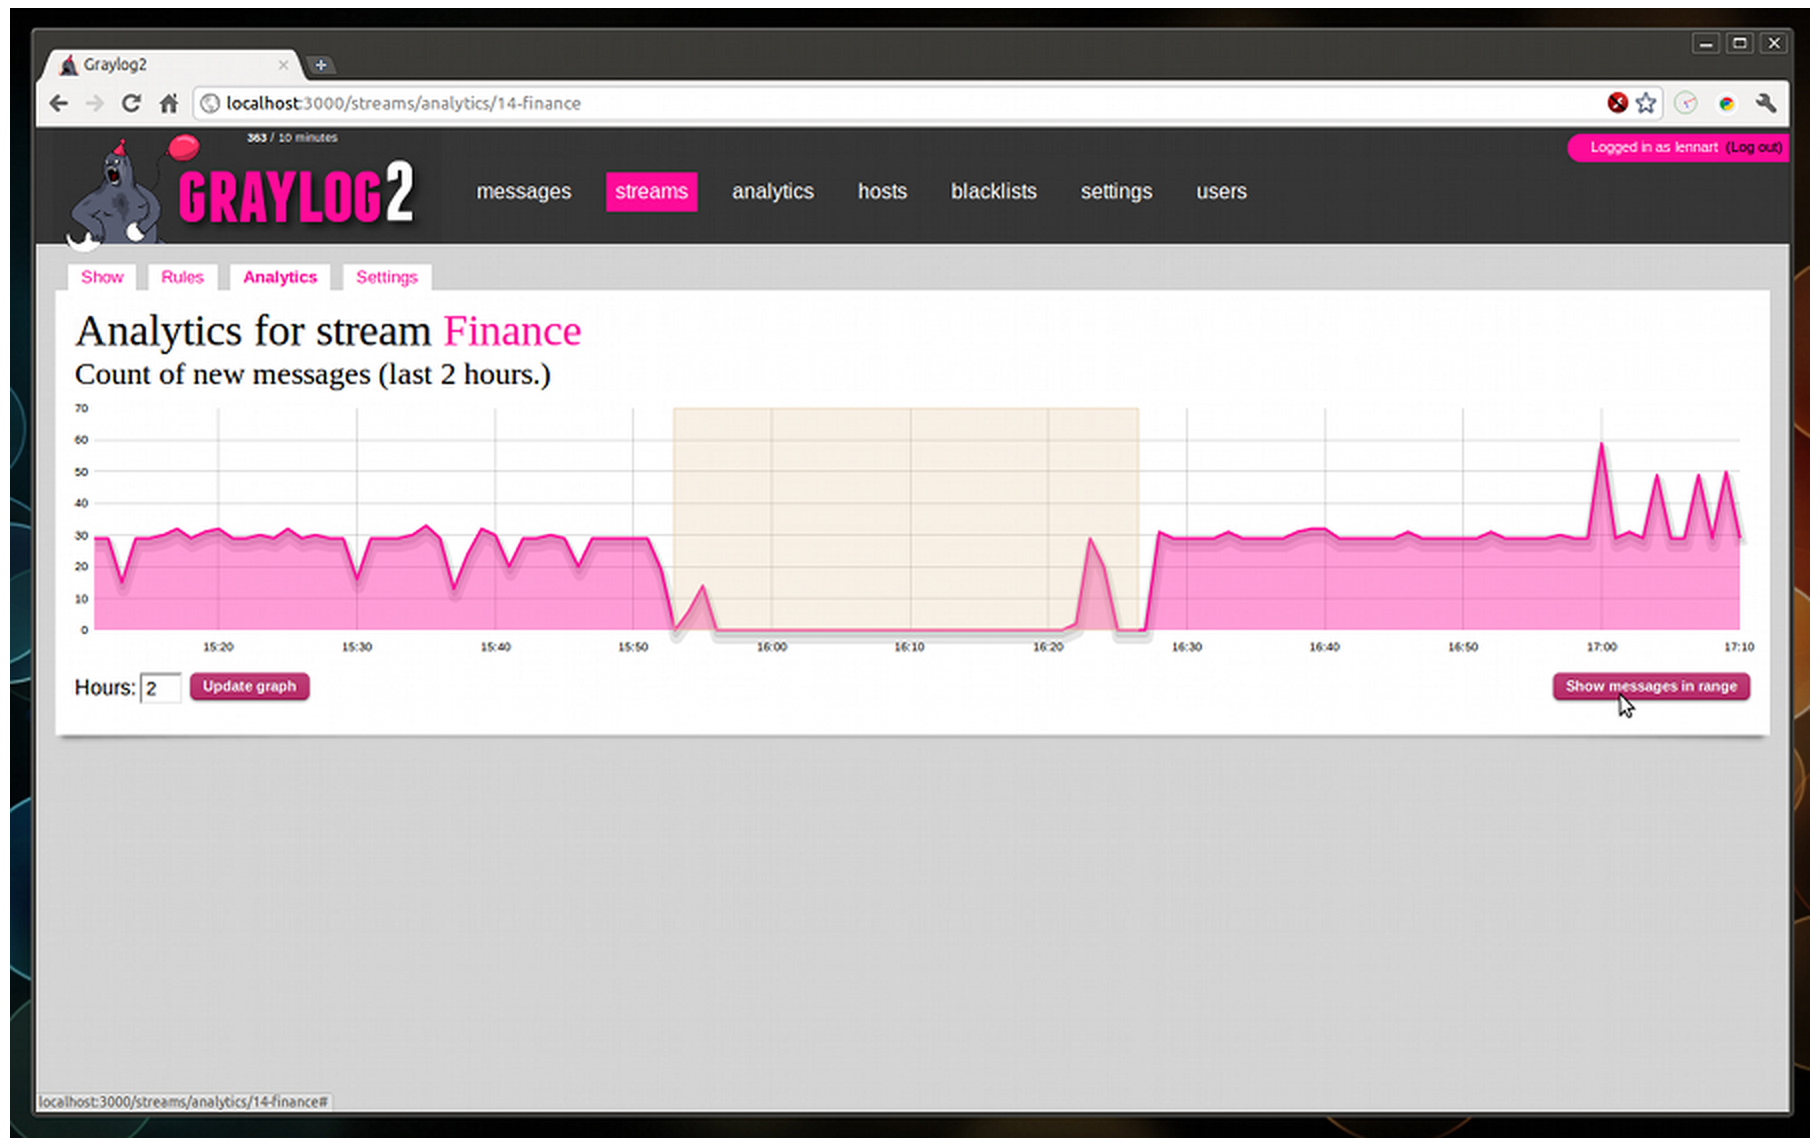
All data sent to Graylog2 will appear in the web interface. Use the web interface to search and filter your data. A core part of the web interface are streams: They basically are saved searches that allow you to quickly access an overview that is already pre-filtered to match for example specific parts of your application. You can also run monitoring and alerting on single streams or directly forward all messages that are matched into a stream to other endpoints.
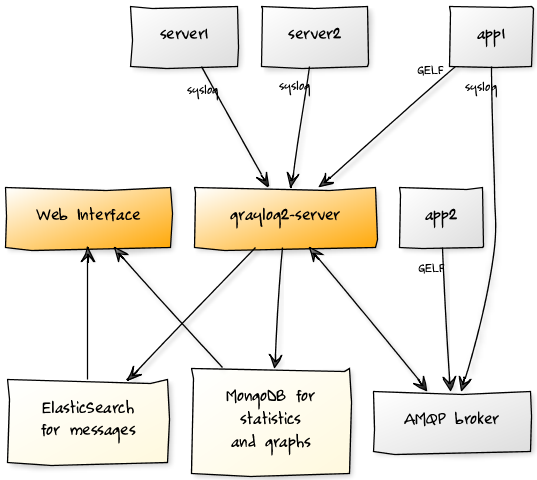
The Graylog2 server accepts standard syslog via TCP/UDP and GELF via UDP, TCP and HTTP. You can also send in both formats via AMQP (AMQP Docs). You can configure your syslog daemons to send their data to Graylog2 or log directly from within your applications.
It consists of a server written in Java that accepts your syslog messages via TCP, UDP or AMQP and stores it in the database. The second part is a web interface that allows you to manage the log messages from your web browser. Take a look at the screenshots or the latest release info page to get a feeling of what you can do with Graylog2.
All data sent to Graylog2 will appear in the web interface. Use the web interface to search and filter your data. A core part of the web interface are streams: They basically are saved searches that allow you to quickly access an overview that is already pre-filtered to match for example specific parts of your application. You can also run monitoring and alerting on single streams or directly forward all messages that are matched into a stream to other endpoints.
The Graylog2 server accepts standard syslog via TCP/UDP and GELF via UDP, TCP and HTTP. You can also send in both formats via AMQP (AMQP Docs). You can configure your syslog daemons to send their data to Graylog2 or log directly from within your applications.
 (Page 215 of 603, totaling 3615 entries)