To test disk performance with the Iometer
- Double-click on Iometer.exe. The Iometer main window appears, and a Dynamo workload generator is automatically launched on the local computer.
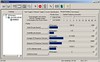
Click on a manager (the name of the local computer) in the Topology panel on the left side of the Iometer window. The manager’s available disk drives appear in the Disk Targets tab. Blue icons represent physical drives; they are only shown if they have no partitions on them. Yellow icons represent logical (mounted) drives; they are only shown if they are writable. A yellow icon with a red slash through it means that the drive needs to be prepared before the test starts; see the Disk Targets Tab — Reference section for more information on preparation. In the Disk Targets tab, select a disk or disks to use in the test (use Shift-click andControl-click to select multiple disks). The selected disks will be automatically distributed among the manager’s workers (threads). Switch to the Access Specifications tab. Double-click on “Default” in the Global Access Specifications list (the one with the globe icon). The Edit Access Specification dialog appears. The Edit Access Specification dialog shows you how the disk will be accessed. The default is 2-Kilobyte random I/Os with a mix of 67% reads and 33% writes, which represents a typical database workload. You can leave it alone or change it. Press OK to close the dialog when you are through. For maximum throughput (Megabytes per second), try changing the TransferRequest Size to 64K, the Percent Read/Write Distribution to 100% Read, and the Percent Random/Sequential Distribution to 100% Sequential. For the maximum I/O rate (I/O operations per second), try changing the Transfer Request Size to 512 bytes, the Percent Read/Write Distribution to 100% Read, and the Percent Random/Sequential Distribution to 100% Sequential. Switch to the Results Display tab. Set the Update Frequency to 10 seconds. Press the Start Tests button (green flag). A standard Save File dialog appears. Select a file to store the test results (default results.csv). After 10 seconds the first test results appear in the Results Display tab, and they are updated every 10 seconds after that. Press the button to the left of each bar chart for a menu of the different results you can display. You can also drag a worker or manager from the Topology panel to a bar chart to see the results of just that worker or manager.
Press the Stop Test button (stop sign). The test stops and the final results are saved in the results.csv file. This is a comma-separated text file that can be viewed in any text editor or imported into a spreadsheet.