Monday, July 29. 2013
Full VMworld 2012 Session - Architecting and Operating a VMware vSphere Metro Storage Cluster
Thursday, July 25. 2013
Sample configuration of EtherChannel / Link Aggregation Control Protocol (LACP) with ESXi/ESX and Cisco/HP switches
Tuesday, July 23. 2013
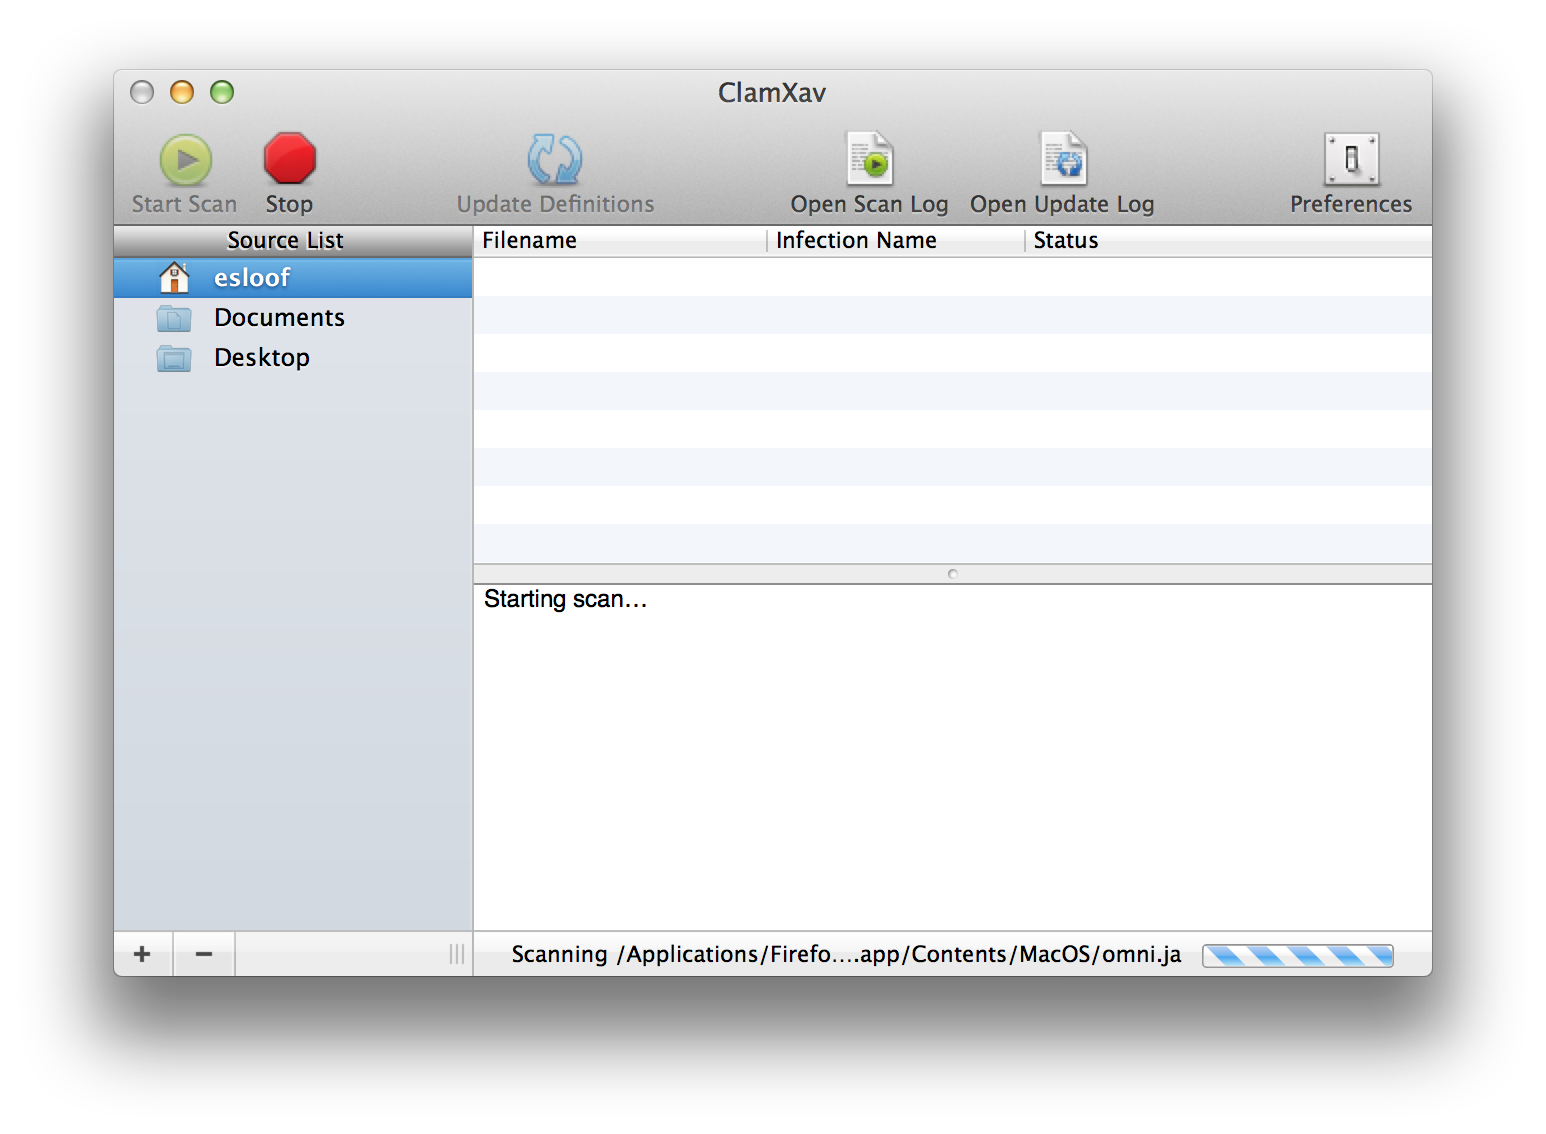
Cool Mac Tool - ClamXav
Back in the days before OS X, the number of viruses which attacked Macintosh users totalled somewhere between about 60 and 80. Today, the number of viruses actively attacking OS X users is none. However, this doesn't mean we should get complacent about checking incoming email attachments or web downloads.
ClamXav is a free virus scanner for Mac OS X. It uses the very popular ClamAV open source antivirus engine as a back end and has the ability to detect both Windows and Mac threats.
ClamXav can be setup up as passive or active: scan only the files you tell it to or your entire hard drive, whichever you prefer; you can also choose to activate Sentry to monitor your hard drive and scan new files as they arrive.
View In iTunes - ClamXav: The Free Anti-Virus Solution for Mac OS X
VMware Knowledge Base (KB) - Linux 2.6 kernel-based virtual machines experience slow disk I/O performance (2011861)
Video - Snapshot Best Practices
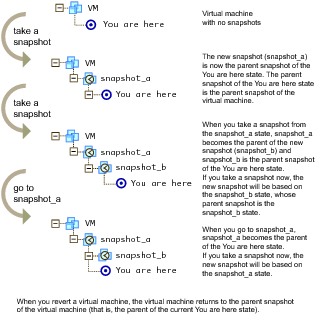 A snapshot is reproduction of the virtual machine just as it was when you took the snapshot. The snapshot includes the state of the data on all virtual machine disks and the virtual machine power state (on, off, or suspended).
You can take a snapshot when a virtual machine is powered on, powered off, or suspended. When you create a snapshot, the system creates a delta disk file for that snapshot in the datastore and writes any changes to that delta disk. You can later revert to the previous state of the virtual machine.
Snapshot hierarchies can become fairly complex. For example, assume that, in the example in Virtual Machine Snapshots, you revert to snapshot_a. You might then work with and make changes to the snapshot_a virtual machine, and create a new snapshot, creating, in effect, a branching tree.
In the following videos, VMware Certified Instructor, Joe Desmond, details the best practices in using Snapshot functionality including:
- vSphere Snapshot Overview
- vSphere Anatomy of Snapshot
- vSphere Power Tools Come with Big Warning Labels
- vSphere Snapshots in Action
- vSphere Snapshots in Non Production Environments
- vSphere Snapshot Consolidation
Cool Mac Tool - muCommander
 If you're not a big fan of the Finder in MacOS, you definitely have to take a look at muCommander, it's a free lightweight, cross-platform file manager with a dual-pane interface. It runs on any operating system with Java support (Mac OS X, Windows, Linux, *BSD, Solaris...).
Here's a non-exhaustive list of what you'll find:
If you're not a big fan of the Finder in MacOS, you definitely have to take a look at muCommander, it's a free lightweight, cross-platform file manager with a dual-pane interface. It runs on any operating system with Java support (Mac OS X, Windows, Linux, *BSD, Solaris...).
Here's a non-exhaustive list of what you'll find:
- Virtual filesystem with support for local volumes, FTP, SFTP, SMB, NFS, HTTP, Amazon S3, Hadoop HDFS and Bonjour
- Quickly copy, move, rename files, create directories, email files...
- Browse, create and uncompress ZIP, RAR, 7z, TAR, GZip, BZip2, ISO/NRG, AR/Deb and LST archives check ZIP files can be modified on-the-fly, without having to recompress the whole archive
- Tabbed navigation
- Universal bookmarks and credentials manager
- Multiple windows support
- Full keyboard access check Highly configurable
- Available in 27 languages : American & British English, French, German, Spanish, Czech, Simplified & Traditional Chinese, Polish, Hungarian, Russian, Slovenian, Romanian, Italian, Korean, Brazilian Portuguese, Dutch, Slovak, Japanese, Swedish, Danish, Ukrainian, Arabic, Turkish, Catalan, Belarusian and Norwegian.
- Free Software (GPL)
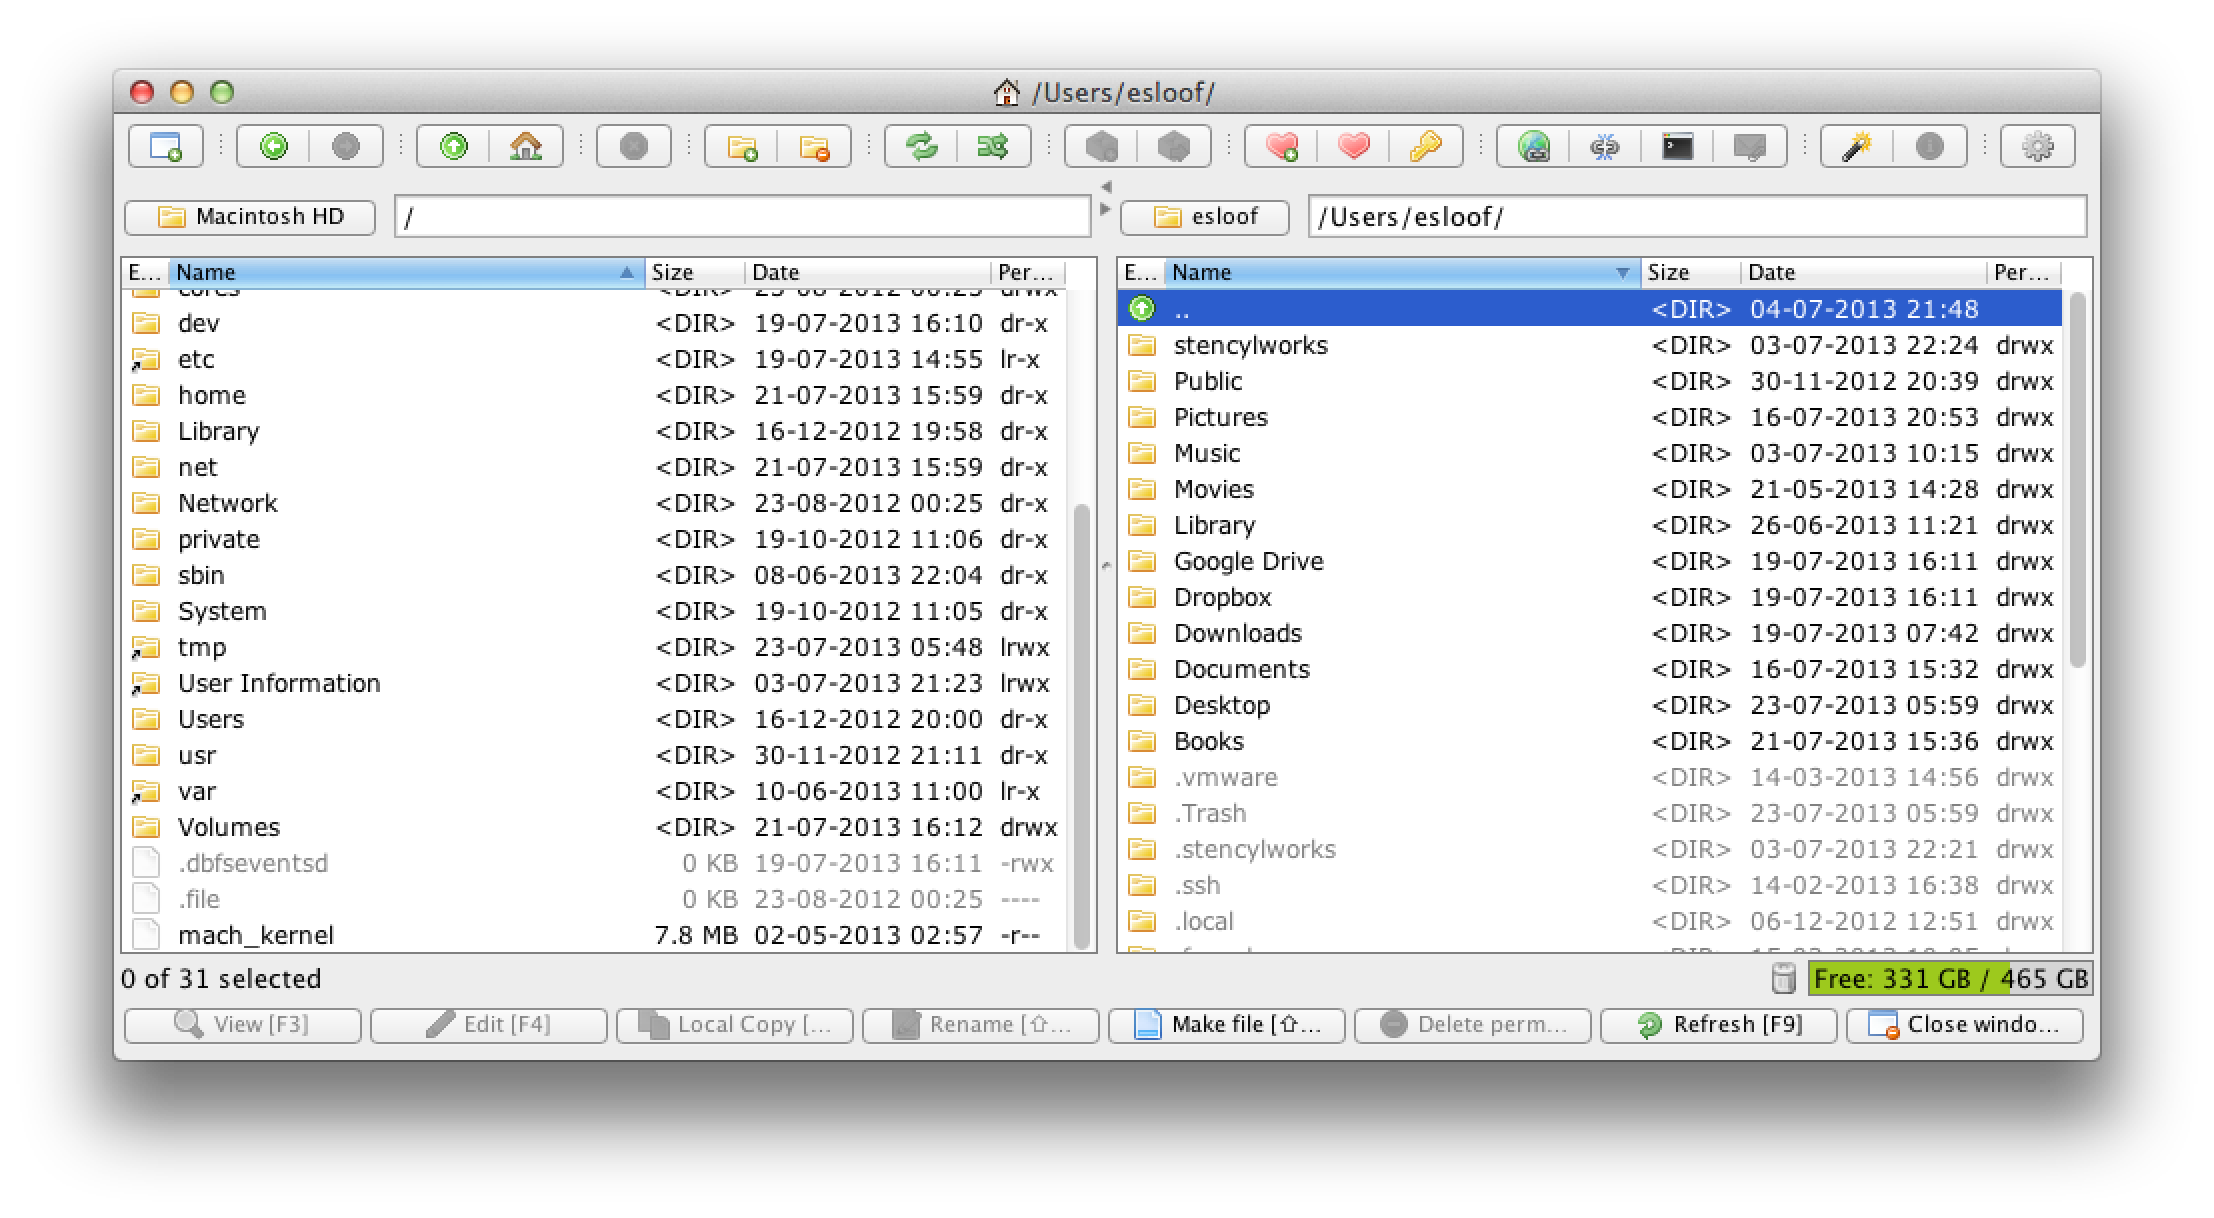
Download muCommander
Cool App - Prowl: Growl Client
 One of my students recommended Prowl for sending vCenter Alerts to my iPhone. Prowl is the Growl client for iOS. It lets you push messages to your iOS device from your Mac or Windows computer, or from a multitude of apps and services. There's also a possibility to easily integrate the Prowl API into your applications. Here are some highlights:
- Push notifications - When a Growl notification pops up on your computer, Prowl sends it over Push.
- Beautiful, elegant list - A clean, easy-to-control list of your notifications.
- Redirections - Opening a push notification can launch a different application, or any website you want.
- Universal, powerful Prowl features an excellent iPad interface to complement you on whatever device you'd like.
- Quiet hours and "Do Not Disturb" - During quiet hours or DND, only the badge count is updated.
- No sounds, no alerts. Send only what you want - The Growl plugin can be configured to only send under conditions you specify.
Thursday, July 18. 2013
Building a Dashboard for a Virtual Infrastructure Administrator
New Book - VMware View Security Essentials
 Most people associate security with network security and focus on firewalls and network monitoring. However, there is more to security than that. Security starts with the establishment of a stable environment, protecting this environment not only from intrusion, but also from malicious intent. It is about tracking the issue and recovering from it. These elements of security are what this book aims to address.
VMware View Security Essentials addresses the topic of security in the corporate environment in a new way. It starts with the underlying virtual infrastructure and then delves into securing your base, your connection, and your client. This is not only a “how-to” book, but is also a book that explains the background and the insights of View security for the experienced professional's desktop virtualization.
This book takes you through the four major View security areas. Each area deals with all the aspects of security and explains the background as well as laying out simple-to-follow recipes to implement a higher security standard.
We start at the Virtualization base and work our way through the various View server types. We will then dive into the problems and issues of securing a connection before we address the security of the desktop itself. We conclude with a look into the backing up of our View installation and preparing for disaster recovery.
What you will learn from this book:
What you will learn from this book:
- Create, use, and install SSL certificates
- Acquire a new skill set in troubleshooting security issues
- Learn about secure tunnelling your desktop connection with RDP and PCoIP
- Understand the concepts of pairing View security and transfer servers with View connection servers
- Understand the key aspects of blocking undesirable USB devices
Go to: VMware View Security Essentials
Tuesday, July 16. 2013
New Book - vSphere Performance Reporting with PowerCLI: Automating vSphere Performance Reports (VMware Press Technology)
 As organizations have extended their usage of virtualization, performance monitoring has become increasingly crucial. But many VMware administrators find it time-consuming and challenging to create and manage VMware performance reports. Fortunately, there’s a fast, powerful, and efficient way to do this crucial job: use VMware’s free PowerCLI snap-in on the familiar Windows PowerShell scripting platform.
 Now, in vSphere Performance Monitoring with PowerCLI , Luc Dekens covers all you need to know to automate performance reporting for both vSphere hosts and individual VMware virtual machines. Responding to multiple requests for guidance on PowerCLI scripting, Dekens explains:
- How vSphere Performance Monitoring works
- Which metrics are available and how to use them most effectively
- How to track CPUs, memory, datastores, virtual disks, networks, and systems
- How to produce performance reports over any regular or custom period
- How to create on-demand reports to troubleshoot emerging problems
- How to optimize your reporting scripts
- How to work with esxtop from PowerCLI
- How to add graphics that make reports easier to understand
When Dekens taught this material at VMworld, he attracted more than 2,000 VMware pros in several standing room sessions: it’s that valuable. If you also run Windows servers, you may already have directly relevant experience with PowerShell scripting; if you don’t, Dekens even provides a concise PowerShell introduction. Bottom line: whether you want to improve reporting in response to existing problems or as a proactive measure to prevent them, this tutorial and reference delivers all the knowledge and scripts you’ll need.
vSphere Performance Reporting with PowerCLI: Automating vSphere Performance Reports (VMware Press Technology)
vSphere Performance Reporting with PowerCLI: Automating vSphere Performance Reports (VMware Press Technology)
 (Page 135 of 366, totaling 3653 entries)