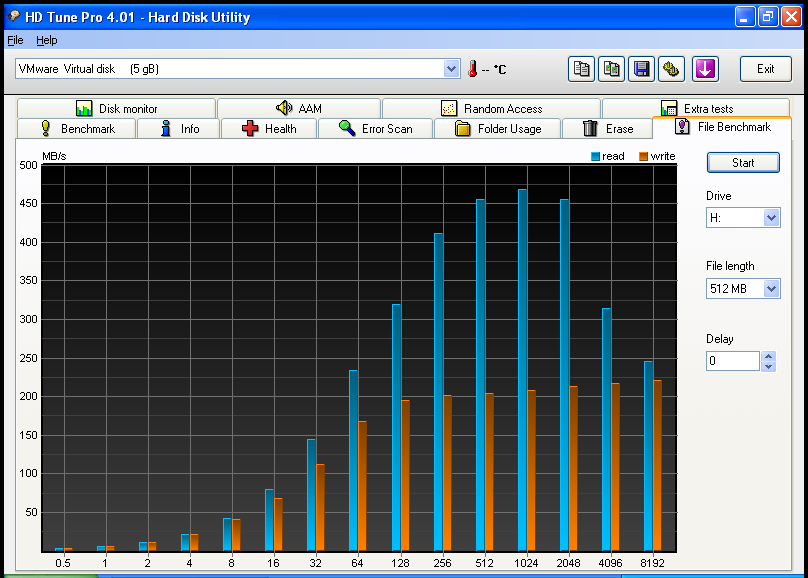
 Sorry for my rude title Scott :-) but I was just on the phone with me ex Capgemini colleague Ernst Cozijnsen and we had a long discussion about super fast storage for replicas in a View environment. In the end we settled for RAM. I immediately jumped into my lab to setup a proof of concept to see how it performs and it’s pure awesomeness, faster than fast and quicker than quick. You want to see what we discussed? Well here’s the story. In the proof of concept I’m using a Windows 2008 64 bit Enterprise server with 7 GB of RAM and the StarWind iSCSI target software. I’ve configured this iSCSI target with a RAM disk of 6 GB and created a VMFS on the iSCSI target. I’ve cloned a Windows 2003 virtual machine to the newly created VMFS hosted in RAM and did some performance checks. I was astounded.
Wednesday, December 15. 2010
Hey Drummonds forget SSD – RAM is the future
Friday, December 10. 2010
Technical Papers -VMware High Availability (HA): Deployment Best Practices
Saturday, December 4. 2010
VMware Product Demo - Memory Compression
Finally, with Transparent Memory Compression, 4.1 will compress memory on the fly to increase the amount of memory that appears to be available to a given VM. The new Transparent Memory Compression is of interest in the workload cases where memory -- rather than CPU cycles -- has limitations. ESX/ESXi provides a Memory Compression cache to improve virtual machine performance when using memory over-commitment. Memory Compression is enabled by default when a host's memory becomes overcommitted; ESX/ESXi compresses virtual pages and stores them in memory.
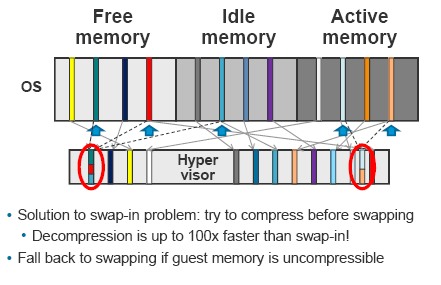
Since accessing compressed memory is faster than accessing memory swapped to disk, Memory Compression in ESX/ESXi allows memory over-commits without significantly hindering performance. When a virtual page needs to be swapped, ESX/ESXi first attempts to compress the page. Pages that can be compressed to 2 KB or smaller are stored in the virtual machine's compression cache, increasing the capacity of the host. The maximum size can be set for the Compression Cache and disable Memory Compression using the Advanced Settings dialog box in the vSphere Client.
Whitepaper - Maximizing Virtual Machine Performance
Thursday, December 2. 2010
vStorage API's for Array Integration (VAAI) product demo
Storage I/O Control product demo
Thursday, November 25. 2010
Transitioning to ESXi with vSphere 4.1
While I was prepping my upcoming “vSphere Advanced Troubleshooting” presentation for the Dutch VMUG event 2010, I stumbled upon a great presentation by Mark Monce. It’s called “Transitioning to ESXi with vSphere 4.1” and contains a lot of information like:
 Overview of ESXi
- Hardware Monitoring and Systems Management
- Infrastructure Services
- Command Line Interfaces
- Diagnostics and Troubleshooting
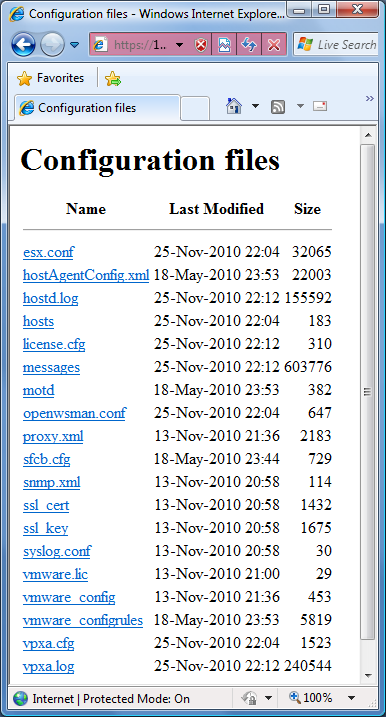
One thing I didn’t know was, that you can use your web browser to retrieve some essential ESXi diagnostic information.
Browser-based Access of Config Files
https://<hostname>/host
Browser-based Access of Log Files
https://<hostname>/host/messages
Browser-based Access of DatastoreFiles
https://<hostname>/folder
Saturday, November 20. 2010
How to configure advanced VMXNET3 settings
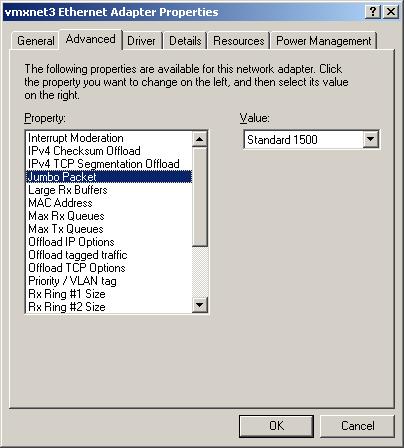 Receive packets might be dropped at the virtual switch if the virtual machine’s network driver runs out of receive (Rx) buffers, that is, a buffer overflow. The dropped packets may be reduced by increasing the Rx buffers for the virtual network driver.
In ESX 4.1, you can configure the following parameters from the Device Manager (a Control Panel dialog box) in Windows guest operating systems: Rx Ring #1 Size, Rx Ring #2 Size, Tx Ring Size, Small Rx Buffers, and Large Rx Buffers.
The default value of the size of the first Rx ring, Rx Ring #1 Size, is 512. You can modify the number of Rx buffers separately using the Small Rx Buffers parameter. The default value is 1024.
For some processes (for example, traffic that arrives in burst), you might need to increase the size of the ring, while for others (for example, applications that are slow in processing receive traffic) you might increase the number of the receive buffers.
When jumbo frames are enabled, you might use a second ring, Rx Ring #2 Size. The default value of RX Ring #2 Size is 32. The number of large buffers that are used in both RX Ring #1 and #2 Sizes when jumbo frames are enabled is controlled by Large Rx Buffers. The default value of Large Rx Buffers is 768.
Friday, November 12. 2010
Understanding and Using vStorage APIs for Array Integration and NetApp Storage
Wednesday, November 3. 2010
Performance Best Practices for VMware vSphere 4.1
 (Page 5 of 22, totaling 214 entries)