VMware has released a great new product which is able to diagnose and analyse vSphere performance metrics. vCenter Operations Standard is for vCenter administrators who want to better understand the performance of their virtual infrastructure, and to diagnose and correct performance problems easily and quickly.
vCenter Operations Standard collects performance data from each object at every level of your virtual infrastructure, from individual virtual machines and disk drives to entire clusters and datacenters. It stores and analyses the data, and uses that analysis to provide you with real-time information about problems, or potential problems, in your enterprise. vCenter Operations Standard presents the data in graphical interface pages that display different views of your virtual infrastructure.
vCenter Operations Standard adds several benefits to your suite of VMware tools
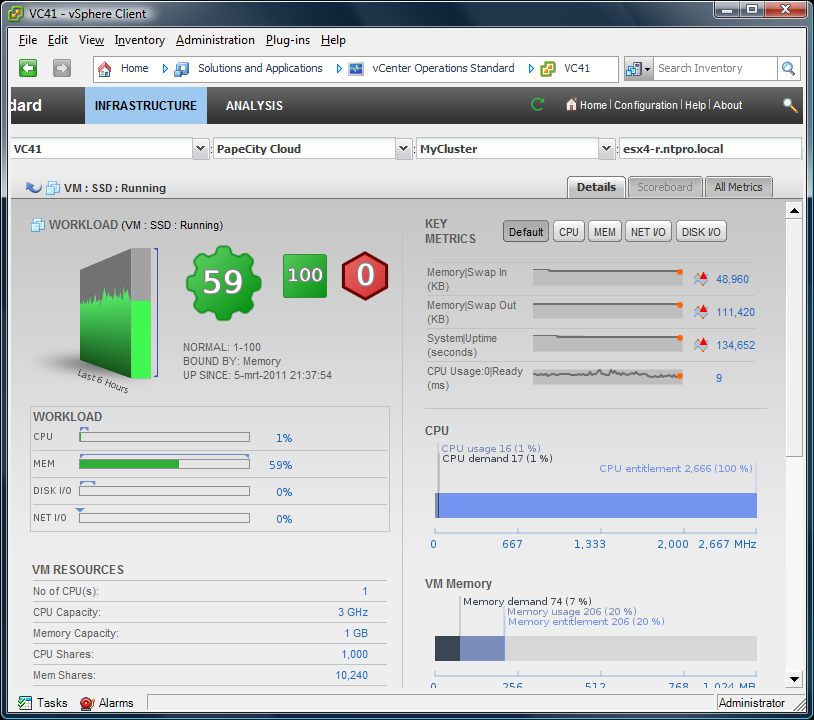
vCenter Operations Standard combines key metrics into single scores for CPU, memory, disk, and contention performance.
vCenter Operations Standard calculates the range of normal behavior for every metric and highlights abnormalities.
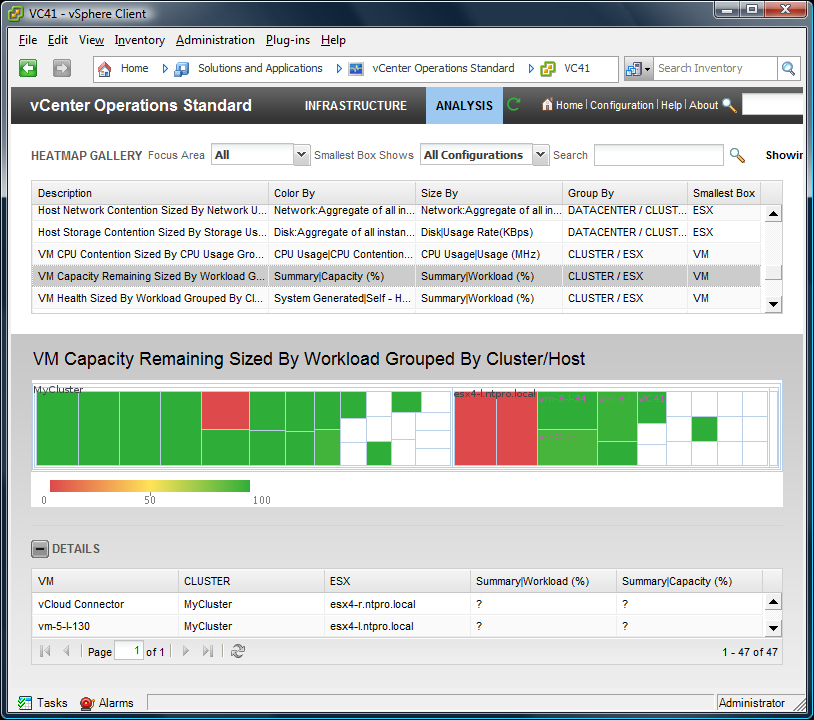
With vCenter Operations Standard, you can view graphical representations of current and historical states of your entire virtual infrastructure or selected parts of it.
vCenter Operations Standard displays information about changes in the hierarchy of your virtual infrastructure and shows how these changes affect the performance of the objects involved. For example, how moving a virtual machine from one ESX host to another ESX host affects the performance of the two ESX hosts and all other related objects.
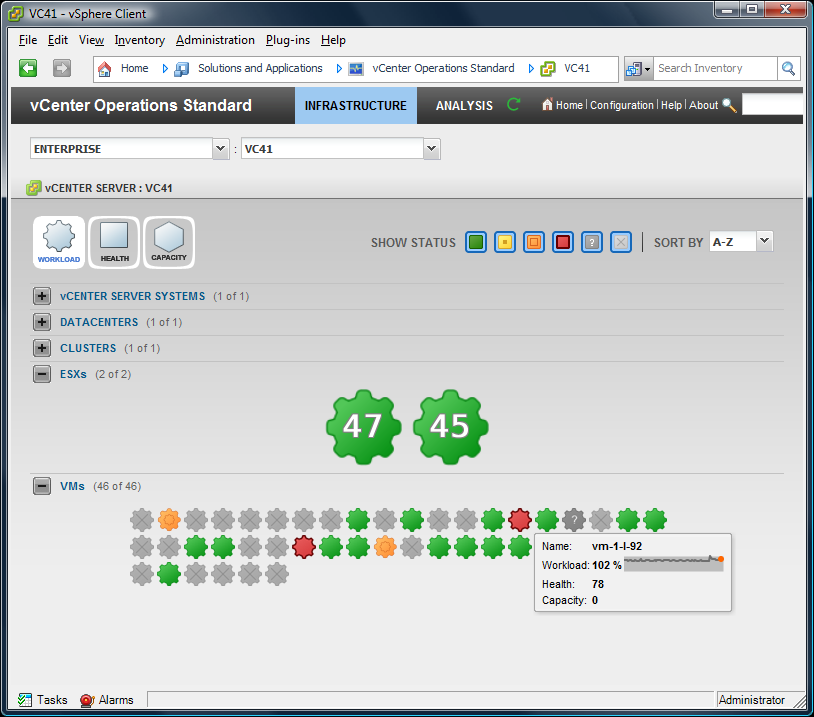
The pages of vCenter Operations Standard Infrastructure view are centered around the performance characteristics of health, workload, and capacity. Each performance characteristic is a complex summary metric. vCenter Operations Standard performs calculations on combinations of related metrics to create a single value to track a particular aspect of the performance of an object.
The health rating gives you a quick overview of the current state of an object, from an individual virtual machine to the entire virtual infrastructure. vCenter Operations Standard calculates health using the performance of the KPI for the object and its child objects, the total number of threshold violations for all metrics for the object and its child objects, and other aspects of the performance of the object and its child objects. The overall health score for an object ranges from 0 to 100. A high health score indicates that an object is behaving in accordance with its established historical parameters. Most or all of the object metrics, especially its KPI, are within their thresholds. Because changes in behavior often indicate developing problems, if the metrics of an object go outside their calculated thresholds, the health score for the object decreases. As more metrics breach their thresholds, health continues to decrease. Violations by KPI metrics decrease the health more than violation by non-KPI metrics.
The analytics algorithms of vCenter Operations Standard combine the metrics that show the demand placed on a virtual machine or other object in a single value, called the workload. These metrics include CPU utilization, memory usage, and so on. An object with a workload score of 0 is not being used. An object with a workload score over 100 is trying to access more resources than area available to it. In this case, you might have to allocate more resources to the object or move some tasks to other objects.
The capacity score indicates how close an object is to exhausting the computing resources that are available to it. These computing resources include disk space, memory size, network capacity, and so on. To calculate the capacity score, vCenter Operations Standard combines applicable metrics from the object and applies its analytics algorithms to determine long-term cycles and trends. vCenter Operations Standard uses these results to calculate when an object is likely to run out of a type of resource, such as disk space.