 The cornerstone of the Xangati VDI Dashboard is its performance health engine that analyzes the health of VDI in an unprecedented four microseconds. Relying on Xangati’s memory-driven architecture, the performance health of the VDI is being continuously monitored across a broad spectrum of performance metrics to the unrivaled scale of 250,000 objects (which can include desktops and clients). In contrast, other performance management architectures are database-driven and unable to keep apace of dynamic interactions to scale that are fundamental to VDI.
The output of Xangati’s performance health engine is a real-time health index that is linked to the health of every client, desktop, network link, host, VDI protocol and IT server that can impact VDI end–user experience. In real-time – as an object’s health shifts – the health index changes to reflect the urgency of the performance issue. Moreover, the performance shift will trigger a real-time alert, which is uniquely paired with a DVR-recording.
 The DVR-recording will show exactly where the performance problem stems from and present contextual insights about what is driving the sub-optimal performance. For instance, a specific user community is seeing obvious delays in screen presentation due to a high latency network link. These DVR recordings capture issues that are often outside of a VDI vendor’s software framework and can be passed to the appropriate IT function, e.g. to the storage team when storage latency is at the heart of the performance issue.
http://xangati.com/vdi_dashboard/
http://d4vu5i9co7ynd.cloudfront.net/VDI_Dashboard.mov
VMworld 2010 Copenhagen - At the labs with Xangati
Continue reading "Xangati's New Release - V(D)I Dashboard" »
 Windows 7
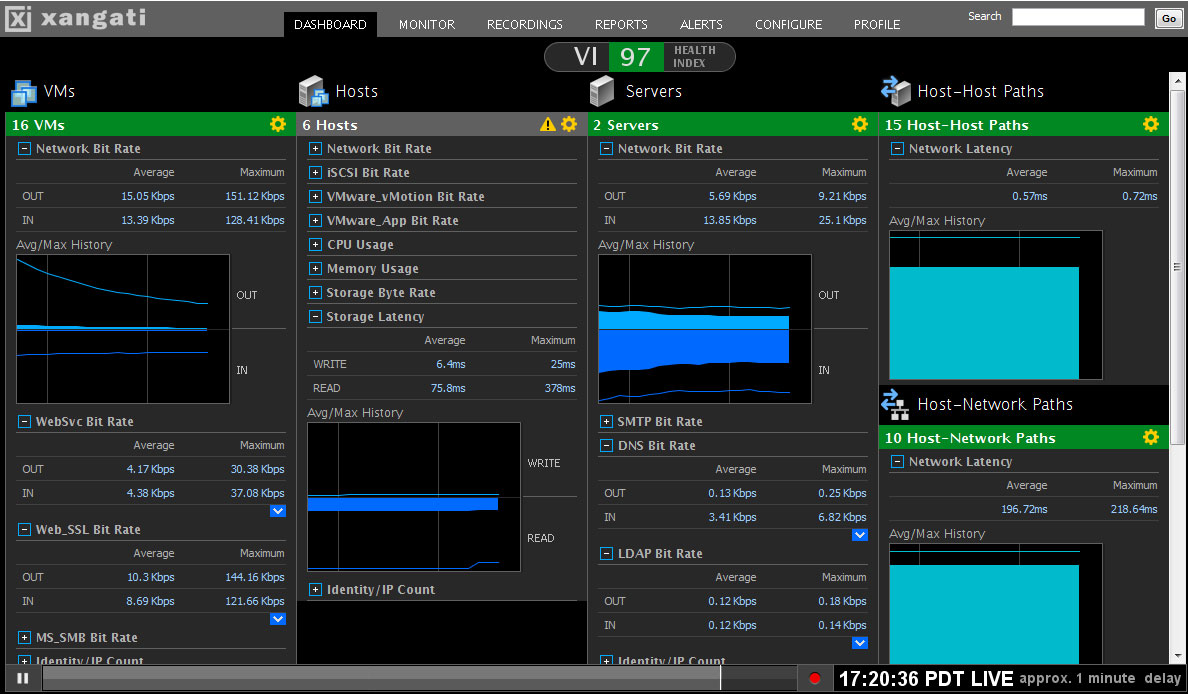

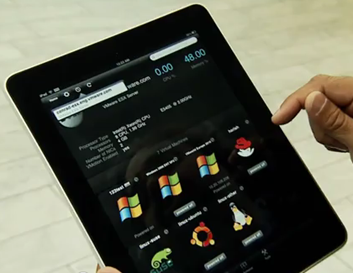
 VMware Labs presents its latest fling Thinapped vSphere Client. This fling uses VMware ThinApp to package vSphere Client into a single portable EXE giving you instant access to your virtual infrastructure from any computer.